Archive
Managing supply risks of rare earths
By Ruggero Golini, Filippo Valoncini, Jury Gualandris
Since the Nineties, rare earths have gained an important role in the World technological development because of their use in the so called green technologies (check our previous posts here and here).
Despite their name, these elements are not so rare; indeed, they are about 200 times more available than gold. Nevertheless, there are only few places on earth where the extraction with today’s technologies is profitable.
In the last decade, China became the monopolist in the sector of rare earth by extracting about 95% of the World total production. In the last years, with the rapid development emerging country economies, the global demand of rare earths rose dramatically bringing to an incredible increase in prices (some elements between 300% and 4000%). Many of the processing stages of the value chain are located in China. China produces more than the 95% of the rare earth oxides, about 90% of the alloys and 75% of Neodymium magnets. Furthermore, many Chinese companies develop high technology products exploiting these materials. Furthermore, the Chinese government has defined policies in terms of export quotas, incentives, customs and external investments. As a consequence of these policies, in the 2005-2009 period exports decreased by 20% down to 50,000 tons. Until 2015 they could be reduced to 35,000 tons.
Because of that, some issue in the global supply chain has emerged.
In 2011, the US Department of Energy (DOE) identified the level of criticality of the most common rare earths in the short and long term. The list shown in the figure represents the short term situation, while arrows describe how the situation will change in the future. The rank is derived according to supply risks (that includes: basic availability; competing technology demand; political, regulatory and social factors; codependence on other markets; producer diversity) and importance to clean energy technologies (that includes: clean energy demand, substitutability limitations….). Interestingly the two variables are quite correlated, that is, the most important materials are at the same time subject to higher supply risks.
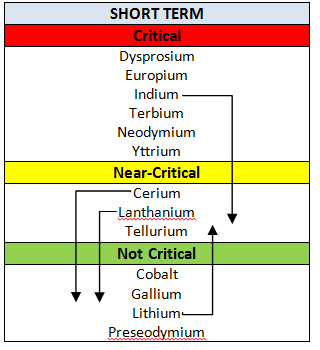
Short and medium term the level of criticality of the most common rare earths
(adapted from US Department of Energy, 2011)
As we can see from the table, the situation is not going to get significantly better in the future and companies should therefore develop specific risk management strategies.
For instance, as reported by the US Department of Energy (DOE) report, Toyota followed two strategies. First of all, it tried to secure its supply of rare earths (used for hybrid and electric vehicles) by establishing a task force to monitor the risks and partnerships with few selected suppliers. Moreover, Toyota is trying to reduce the dependency on rare earths by redesigning the products, for instance, electric motors.
Sources
http://www.greenreport.it/_new/index.php?page=default&id=14067
Rare Earth Elements: The Global Supply Chain, Marc Humphries September 30, 2010
Study on Rare Earths and Their Recycling, Final Report for The Greens/EFA Group in the European Parliament, Oko Institut e.V., January 2011
Critical Materials Strategy, U.S. DEPARTMENT OF ENERGY, December 2011
Sustainability Management and Risk Management in the consumer electronics industry
by Ruggero Golini, Greta Facoetti, Jury Gualandris
This post raises and briefly addresses the following questions: can companies in the consumer electronics industry benefit from the integration of sustainability and risk management in their supply chains?
The consumer electronic industry has a highly innovative rate, provides a wide range of devices and equipment and its global value chain is very complex. In the time of one generation, the high-tech revolution has spread worldwide, with tremendous impacts on the environment and society.
In the recent years, several scandals have hit some of the industry’s leading companies, such as Apple, because of issues occurred in their supply chains.
However, despite the increasing concerns, the heterogeneity of social and environmental regulations and policies around the world is working as a barrier to the development of more sustainable supply chains. In this context, developing countries are particularly vulnerable because they perform most of the assembly operations, but they retain a low share of the value added and there is little visibility on the final markets of what happens there. Moreover, governments in question are often focused on industrial growth at the expense of environmental and social aspects.
Because of that, leading firms are trying to address environmental and social issues at different stages of their supply chain.
In our analysis, we wanted to check whether the effort put by these companies to solve an issue is related to the risks potentially occurring because of that issue.
First of all, according to the Greenpeace sustainability ranking, we have identified a set of practices electronics companies can undertake to address sustainability issues along their supply chains. Next, we have selected a cluster composed by the 10 most profitable companies in the industry (Samsung, HP, Sony, LG, Toshiba, Nokia, Panasonic, Apple, Dell and Acer). After that, we have associated a score from 0 (low level of action) to 3 (high level of action) to each company for each one of the considered practices on the basis of the same Greenpeace report. Finally, we have calculated the average level of effort for each practice in the electronic industry (Figure 1).
Figure 1 – Average level of effort put into different sustainability practices by top 10 lead firms in the electronic industry

Interestingly, energy efficiency of products is the practice that receives most effort. On the other hand, the policies on clean energy, recycling and recovery of plastic products seem to be least developed.
Next, we have calculated the risks for the leading companies associated to each issue previously identified. The global risk level, measured on a scale from 0 (no risk ongoing) to 3 (highly relevant risk), is built on considerations that concern:
- environmental risks (pollution, relaxation / lack environmental standards)
- social risks (workers’ exploitation, workers’ rights, health and life)
-
risks of supply (shortage, supply disruption, conflict zones)
The scores were given on the basis of information got from multiple sources (the complete list is indicated in the references.
Finally, a comparison between “level of effort” and the “level of risk” for each specific environmental issue has been performed (Figure 2). This analysis allows to reconnect potential sustainability risks with what the companies are actually doing.
Figure 2 – Comparison between the level of effort and the level of risk

The resulting picture shows that for the energy efficiency issues (the first 5) the level of effort matches the risk. However, the other risks, especially the last four related to the supply chain are associated to the highest level of risk but the effort is not apportioned.
This result can be dependent on the fact that working on the supply chain is more difficult than other areas. However, another reason could be that the effort of the companies is driven by the pressures of the stakeholders rather than by a critical analysis of the issues in the global value chain.
References
- “Carbon EmissionsMeasuring the risk. An S&P 500 NFS International Sector Report” authored by Trucost
- “Sustainable Water Management for Electronics Industry”, authored by Siemens
“Green Management Activities and Performance” authored by Samsung, Electronics Sustainability Report 2012 - “Responding to Climate Change Risk: Basic of GHG Emission Inventories”, authored by E Source Companies LLC 2006
- “Managing Supply Chain GHG Emissions, lesson learned for the road ahead”, authored by EPA, 2010
“COOL IT, Leaderboar December 2010”, authored by Greenpeace - “The Hidden Consequences, The cost of industrial water pollution on people, planet and profit”, authored by Greenpeace
- “Effective action on global warming prevention by the electrical and electronics industries” authored by Liason Japanese Group
- “Water Scarcity &Climate Change: Growing risk for business & investors”, authored by The Pacific Institute, 2009
- ” Conflict minerals: What you need to know about the new disclosure and reporting requirements and how Ernst & Young can help”by Ernst&Young
- “I costi umani di un Ipad”, authored by Internazionale n°934, February 2012
- “Il disastro giapponese mette a rischio la fornitura di batterie e memorie cellulari”, Il Sole 24 Ore, 14 March 2011
- “Building Resilience in Supply Chains”, authored by Accenture World Economics Forum, 2013
” Sustanaibility: A risk Management perspective”, authored by David Singleton www.sustdev.org SDI 1616/5 - ” The case for integrating sustainability and risk management: why sustainability must be a priority for corporate risk managers”, authored by Aon Corporation, 2009
- “Knowing your risk: managing the value at risk from sustainability issues”, authored by PWC
eventuali report aziendali
Similar products, different footprint stories
by Ruggero Golini and Marco Gervasoni, Università degli Studi di Bergamo
In a world of global supply chains, two products that look very similar, can have very different footprint stories.
The Life Cycle Assessment analysis applied to the environmental footprint of the products along the supply chain offers an interesting perspective on how products that look similar can be, in practice, very different. This particularly true in global supply chains where the technological choices are combined with localization and transportation choices.
Because of that, we compared the carbon footprint of two pairs of sunglasses (Ray-Ban RB3025 Aviator and Oakley Whisker) made by the same company (Luxottica) and using information from the EPD (Environmental Product Declaration) developed by the International EPD. We also used Sourcemap to draw maps of the supply chains of these two products.

The first sunglasses are the Ray-Ban RB3025 Aviator. The supply chain is quite straightforward with raw materials and components (upstream processes) coming from China and Europe. Then part of the manufacturing activities (core processes) is performed in China (for the frame) and the rest in Italy.
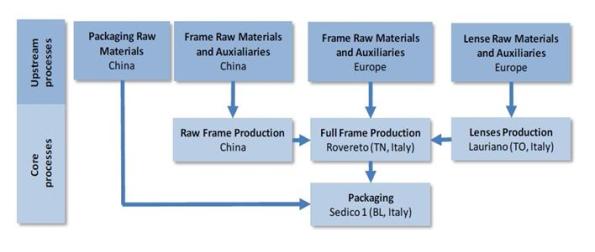
From the geographical point of view, the supply chain appears as follows (the locations are approximated). (https://sourcemap.com/view/5390#):

On the other side, the supply chain of the Oakley Whiskers involves less partners, but more countries. In fact, part of the production (the lenses) is made in California (USA) and sent to China.
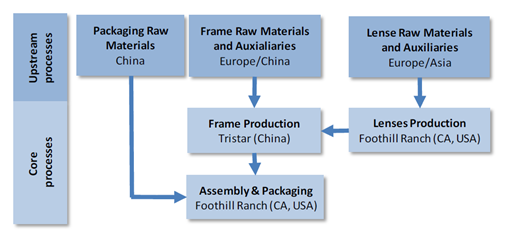
The resulting map, looks like this (https://sourcemap.com/view/5406#):

Focusing on the CO2 emissions, we can notice that the Oakley Whisker produce 13% more CO2, mainly because of production processes.

CO2 emissions (in Kilograms) – source: authors elaboration. The emissions due to transportation are based on authors0 estimates and checked with SourceMap statistics
However, it is worth noticing that the Oakley have about half of the weight of the Rayban (65 g vs 121 g), mainly because of the glass-made lenses of the latter. This means that, because of a more complex supply chain and production process, the Oakley have almost double CO2 emissions per gram.

Total KgCO2 / gram
Moreover, because of supply chain localization choices the distribution of CO2 emission is quite uneven among countries. The next figure reports the emissions of CO2 in the different countries (excludes transportation):
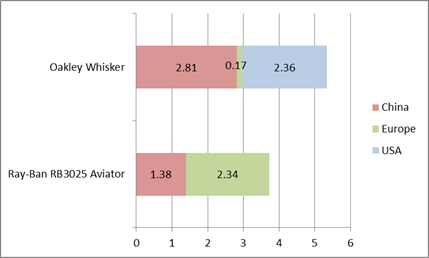
KgCO2 emissions by country
In conclusion, we can see how supply chain choices can strongly affect CO2 emission and where these emissions are produced and how each product has it is own story.
Now, can we help you in tracking your footprint along your supply chain? Let us know!
References
For Ray-Ban RB3025 Aviator: http://gryphon.environdec.com/data/files/6/8960/epde405_Ray-Ban_%20Aviator%203025.pdf
For Oakley Whisker: http://gryphon.environdec.com/data/files/6/8964/epde409_Oakley_Whisker.pdf
When Sustainability means Accountability
PREMISE: with this post we aim at raising attention around the relationship between Sustainability and Accountability. According to literature (e.g., Sharma and Henriques, 2005), the development of sustainability-oriented strategies and practices is greatly driven/influenced by stakeholders’ demand. Stakeholder groups (Governments, NGOs, Local communities, shareholders, customers, etc.), however, have different and contrasting goals, which results in a disparate number of sustainability requirements (Hall and Vredenburg, 2005). Therefore, in practice, sustainability-oriented strategies and practices vary extensively in terms of focus (CO2, Water, Energy, Waste, Health and safety, Child labor and Workers Rights, etc.) and extension (e.g., be developed inside a firm’s boundaries or, instead, cover several tiers of a supply chain). The question, thus, becomes: What should companies account for? and, Why? Here, we approach the sustainability-accountability issue, concluding that future research should be developed to provide some more insights.
Few months ago we provided initial evidence of the growing trend characterizing sustainability-oriented programs in businesses. Nowadays, this trend does not seem to slow down: a recent KPMG International CSR Survey found that 95% of the world’s 250 largest companies are strongly committed towards sustainability and are actually disclosing information around their environmental and social impacts.
By carefully observing the phenomenon of sustainability, one may also recognize an enlargement in the scale of sustainability-related strategies and practices: from a focus on the focal organization and on environmental issues, towards a more supply chain oriented perspective that covers both environmental and social dimensions of the triple bottom line. For instance, corporate initiatives are moving from Scope 1 (i.e., emissions I own and emit – direct emissions) required by regulation, towards Scope 2 (i.e., indirect emissions reporting due to electricity and district heating and cooling) and even Scope 3 (i.e., indirect emissions along the entire value chain, from sourcing to utilization of products and even recycling them). The Greenhouse Gas Protocol (GHCP) initiative is a SCOPE 3 remarkable example. On the social side, a recent important initiative is the “conflict minerals’’ provision of the Dodd-Frank Wall Street Reform and Consumer Protection Act
Given this trend, the question becomes: what should companies account for? and why? Trying to address this question, we looked at existing initiatives around this topic. The existing G3 guidelines (i.e., third version of the Global Reporting Initiative), for instance, state that:
The Sustainability Report Boundary should include the entities over which the reporting organization exercises control or significant influence both in and through its relationships with various entities upstream (e.g., supply chain) and downstream (e.g., distribution and customers).
The emphasis here is on what a firm can directly control for.
Conversely, the current G4 draft (e.g., last version of the GRI guidelines) includes substantially more indicators for supply chain performance than G3, and suggests that companies should account for all the material aspects of their business. Materiality, however, is something very broad: the G4 principle suggests that a firm’s report “should covers topics and indicators that substantively influence the assessments and decisions of stakeholders”. This recalls a general definition of materiality as what would be useful to stakeholders considering a “total mix” of information in their decision making (for further details, see a recent study by the Harvard University on “materiality and sustainability“).
The issue of materiality leads to the concept of accountability. Broadly speaking, accountability refers to the necessity for businesses (pertaining to any industry) to take cognizance of stakeholders’ perspectives and manage any issue that may be salient to them, although out of their control. Stakeholders may indeed affect a firm’s performance by varying the provision of resources that are necessary to its survival and success. Nowadays, even stakeholders that find it hard to directly exert power on a firm (e.g., citizens) may take advantage from several initiatives managed by other stakeholders groups (e.g., NGOs) and indirectly influence the way companies conduct their business. An example is provided by the recent “End Ecocide” initiative or the “change.org” organization.
The broad definition of materiality used by G4 raises several concerns. For instance, a recent post by the UCLA university says:
e.g., for a bank, does “focus on materiality” mean that social aspects of lending practices should now be reported? For an auditor, how can they truly assure that a firm’s sustainability report is accurate, if that report now has to include many disclosures that fall well outside the firm’s boundaries? The process behind this more extended reporting can be valuable: firms have reported that mapping their value chain as part of their sustainability reporting efforts led to a better understanding of the structure of their supply chain. But it is a stretch from current practice to ask CEOs to sign statements that certain aspects are simultaneously material and effectively outside the firm’s control.
Concluding, two questions need to be addressed by academics and practitioners: (1a) What does accountability mean in the context of sustainability? (1b) How does the definition of materiality influence the behavior of companies and the way they address sustainability issues? (2a) What about the mismatch between control and accountability? (2b) How does this impact a firm’s triple bottom line?
What’s your opinion concerning this issue???
References:
Hall, J., Vredenburg, H., 2005. Managing stakeholder ambiguity. MIT Sloan Management Review 47, 11-13.
Sharma, S., Henriques, I., 2005. Stakeholder influences on sustainability practices in the Canadian forest products industry. Strategic management journal 26, 159-180.
The copper global value chain and the black hole of China
Raw materials global value chains are becoming increasingly relevant for the world economy. In this article, we focus on the global value chain of copper and copper-based alloys that are used in a broad variety of applications in everyday life. Copper, in fact, is an indispensable asset today and presumably will continue to be so in the future. However, its global value chain shows some peculiar characteristics with a dominant role of very few countries.
The copper global value chain can be divided into four main stages:
- mining production
- fabrication and manufacture
- product use
- end-of-life management
Let’s focus on the first two stages (mining production and fabrication).
The mining production phase includes the following sub-phases: extraction, smelter and refinery.
Extraction of copper-bearing ores is the initial production activity. There are three basic ways to mine copper: surface, underground mining and leaching. Open-pit mining is the predominant mining method in the world. In the beginning of the 20th century world production was less than 500 thousand tons of copper, but then it has grown about by 3% per year to reach over 16 million tons in 2011. The leading country is South America that grew from less than 750 thousand tons of copper in 1960 to 7 million tons in 2011 (of which 5.3 come from Chile).
Next, smelting is the process used to produce pure copper. The output of this phase is called anode or blister. In 2011, world copper smelter production reached 15.8 million tons copper (that is, about 100% of the extracted copper). Recently, the new process of leaching has been introduced and increasingly used (SX-EW). Primary smelters use mine concentrates as their main input. Secondary copper smelters use copper scrap that derives from either metals discarded in fabrication or finished product manufacturing processes (“new scrap”) or obsolete end-of-life products (“old scrap”). In this sub-phase Asia is the dominant player with a share of world copper smelter production jumped from 27% in 1990 to 55% in 2011. Taking into account 2011 primary and secondary smelting, China accounted for around 30% of world copper smelter production, followed by Japan (9%), Chile (9%) and the Russian Federation (5%). Finally, the copper is refined.
After that, in the fabrication phase we analyze the production of semis. The semis is the copper with a defined shape such as cathodes, wire bar, ingot, billet slab and cake into semi-finished copper and copper alloy products. Semis fabricators are considered to be the “first users” of refined copper and include ingot makers, master alloy plants, wire rod plants, brass mills, alloy wire mills, foundries and foil mills. Also in this phase, Asia is the dominant player and in fact it accounted for 66% of semis production in 2010 with more than 15.2 million metric tons, up from 22% in 1980.
From this brief analysis the most relevant result is the leading role of China. While Chile is the main exporter of copper, China has the lead in the following phases (table 1). This explains why there is a huge export flow from Chile to China or raw copper, but then the international trade flows of refined copper are very limited especially those out flowing from China. As a matter of fact, the production remains concentrated in China until the copper is used in final products creating a kind of black hole.

Table 1 Ranking dominant countries involved in copper production.
References:
-
International Copper Study Group, ICSG World Copper Factbook 2012, http://www.icsg.org/
-
Copper Development Association Inc., Annual Data 2012: Copper Supply & Consumption 1991–2011, http://www.copper.org/resources/market_data/pdfs/annual_data.pdf
-
MBendi Information Services, http://www.mbendi.com/indy/ming/cppr/p0005.htm
The reaction of supply chains to the crisis: the shifts of global trade flows
 As a reaction to the global crisis, supply chains are changing their geography. The traditional western markets are not recovering from the crisis and seems that their economies are following a W or L-shape pattern rather than the expected V-shape. Because of that, global supply chains are shifting to other markets, and the so called South-South trades are increasing. If we look at the table (2010 WTO data of merchandise trade), we can see that the higher flows still occur from Asia to Europe and North America (about 1.6 trillion dollars) and vice versa (about 800 billion dollars). China accounts two thirds of these flows. However, looking at the difference between 2008 and 2010 (only two years) we can see that the flows from Asia to Europe and North America have been quite stable. All the other flows directed to North America and Europe have decreased more than 5% (for instance from South and Central America or Africa). On the other side, all the flows directed to Asia increased more than 5%, except from Middle East that has intensified the exchanges with South and Central America. Also the exchanges from Asia to South and Central America and to Africa have increased more than 5%. It will be interesting to follow the trend as soon as 2011 data will be released. So far, looks like Asia represents the new market where flows from every continent are directed. On the other side, Asia which is a huge manufacturing country is seeking for new markets (for instance South and Central America or Asia) to reduce the dependence from the uncertain traditional European and North American markets.

2010 merchandise trade data (WTO) – The darker the color, the greater the flow
Sustainable supply chain: a new business challenge
Nowadays, companies are increasingly scrutinized by various audience (e.g., NGOs, Social Media) and are held responsible for environmental and social performance of their suppliers (e.g., Apple, 2006; Nike 2007; Mattel, 2007; Victoria’s Secret, 2011). This is the life cycle perspective: products (and the company that is manufacturing them) cannot be truly defined sustainable whether purchased components are not designed and produced in a sustainable way.
A recent post on software advice discusses the “conversations that must occur within supply chain … to become synonymous with … socially-responsible business”. The post focuses on three main points:
- Measuring sustainability performance: as described by Wal-Mart, indexing environmental and social performance throughout the supply chain is essential to instill sustainability into suppliers, lead higher quality and lower costs, and to help customers in their buying decisions;
- Developing trust and value-added relationships along the value chain: when a sustainable supply chain has to be developed, ensuring the quality of the product and the sustainability of the operational process might be as much of an issue as building partnerships and prescribe suppliers’ commitment;
- Innovating toward sustainability: addressing sustainability further upstream – at the level of product and components design – can lead to an improved sustainability as well as costs savings. A good example for that is the case of Ikea: they are looking to replace wood pallets with cardboard ones. The company expects to reduce its carbon footprint and cut its transport bills by 140 million Euro a year (look at this recent post).
However, the above conversions are difficult to develop and “supply chain management” is actually the least area in which sustainability has been integrated (i.e., McKinsey survey, Exhibit 2). First, measuring sustainability is not so straightforward: on one hand it increases upstream competition (e.g., look at the post “Indexing sustainability” by The Operation Room), and on the other new criteria and assessment procedures have to be developed (e.g., look at the post “Sustainability index hiccups” by The Operation Room). Then, the evolution of sourcing strategies and the inclusion of sustainability requires a transitory period necessary for companies to change the focus of their actions (e.g., from a focus on products and suppliers to a focus on relationships and supplier networks in a long-term perspective; from the procurement of standardized inputs to joint-value creation methodologies). For instance, according to a recent post by Harvard Business Review, “nowadays innovation partnerships with vendors don’t yet represent a procurement priority” and “business world innovations occurs when we bypass or disintermediate procurement … this is somewhat contrasting: vendor/partners — who are compensated by procurement — end up having to explain away or conceal the bootleg or graymarket innovation projects they’re billing for … This dynamic is unsustainable… procurement has to become a genuine facilitator, enabler and champion of the innovation ecosystem”.
Thus, to effectively pursue the above supply chain conversions, companies need a transitory period for developing new capabilities (note that, according to exhibit 5 of McKinsey survey, three of the barriers that prevent companies from capturing potential value from sustainability initiatives are: the lack of key performance indicators, insufficient resources and lack of right capabilities and/or skills).
Sustainable supply chain management (SSCM) is also increasingly debated by academicians: more than three hundred papers were published on such issues during the last decade (e.g., Seuring and Müller, 2008). During the conference organized by the International purchasing and supply Education and Research Association (i.e., 2012 IPSERA conference), 17 papers (out of 124) were presented that deal with supply chain sustainability, witnessing that the academic community is greatly interested to the topic. Among the others, the empirical research that has won the 2012 IPSERA best paper award (i.e., Golini et al., 2012) offers relevant contributions on supply chain conversions and the role of companies’ supply management capabilities. Specifically, the paper points out that, although internal investments (e.g., initiatives to improve social reputation as well as initiatives to reduce energy consumption and waste of internal operations) represent the first step toward sustainability, industrial firms should then focus on supply chain management investments (e.g., restructuring the supply base, improving suppliers’ selection, development and coordination) and sustainable supply chain management initiatives (e.g., monitoring CSR of upstream partners, developing life cycle analysis involving suppliers) since they significantly contribute to firms’ sustainability performance. On one hand, SCM investments help in (1) improving companies’ ability to manage strategic supply relationships for sustainability and innovation (2) increasing visibility and reducing moral hazard within supply chain, as well as (3) improving cooperation and inter-organizational learning among partners. On the other, SSCM initiatives entail problem-solving routine involving suppliers and can instill additional capabilities in the company’s organization.
Concluding, supply chain sustainability seems to be the new business challenge: it represents a big opportunity for companies to improve their footprint and to increase their competitive advantage. Nevertheless, firms should wonder whether they hold the right level of resources and capabilities before to rely on SSCM investments.
References:
Seuring, S. and M. Müller (2008). From a literature review to a conceptual framework for sustainable supply chain management. Journal of Cleaner Production 16, 1699-1710.
Golini, R., Gualandris, J., Kalchschmidt, M., 2012. Sustainable supply chain management: the role of supply chain management investments and of Global sourcing. IPSERA proceedings ISBN 978-88-495-2346-1, April 2012 Naples (I).
Sustainability: what about companies’ agendas?
A recent post by the University of Nevada points out that on the top fortune 500 firms in America, almost all are committed towards sustainability. Replicating such analysis within the Italian context, we found similar results. We focused on the 10 Italian companies that rank on the top fortune 500 global firms. As shown in table 1, 9 of them maintain webpages on sustainability and have published CSR reports during the last decade. Furthermore, 6 of them were found on the last Dow Jones Sustainability Index (DJSI). Additionally, by looking at CSR management network, Soliditas Foundation, Ethics footprint and Accountability rating (i.e., Italian networks of companies that are pushing forward sustainability campaigns), we’ve discovered that almost 180 big and well-known Italian firms are engaged in environmental programs and social initiatives (see table 2).
Apparently, we can provide a positive response to our question: nowadays sustainability represents an hot topic for the business community. Accordingly, a recent McKinsey survey points out that “many companies are actively integrating sustainability principles into their businesses and they are doing so by pursuing goals that go far beyond earlier concern for reputation management”. Specifically, saving energy and reducing waste of operations help companies capture value through return on capital and represent the main motivators for companies investments toward sustainability”. Managing corporate reputation and responding to regulatory constraints appears to be respectively the third and the fourth motivators (see Exhibit 1)
A second interesting finding of the McKinsey survey regards the economic returns of sustainability initiatives. In the report it is clearly stated that: “In our sixth survey of executives on how companies understand and manage issues related to sustainability, this year’s results show that, since last year, larger shares of executives say sustainability programs make a positive contribution to their companies’ short- and long-term value. Specifically, they expect operational and growth-oriented benefits in the area of cutting costs and pursuing opportunities in new markets and products”. Such McKinsey’ findings are aligned with what discovered by the 2011 Accenture survey. The focal points of the Accenture’s report are: (1) sustainability motivators and (2) sustainability benefits. First, “top motivations for sustainability are a genuine concern for the environment and society (cited by 53% of respondents), reducing energy and material costs (50% of cases) and responding to customer expectations (47%)”. Second, “the benefits resulting from firms’ sustainability initiatives have exceeded executives’ expectation in the 72% of cases”. As stated by Bruno Berthon (Managing Director of Accenture) “the irony is that … who don’t enjoy these benefits are likely the ones who think sustainability is peripheral to their business”.
Hence, it seems that companies are increasingly paying attention to sustainability. The reason for this relates first to the executives’ personal committment to transact a business in a manner expected and viewed by society as being fair and responsible, even though not legally required. However, a large part of investments are undertaken in order to increase operations’ efficiency and achieve cost benefits. A relevant role is also played by market forces: firm reputation is still at the center and the customers concerns of sustainability exerts a significant effect on firms behaviors. Finally, regulatory pressures appears to be less critical in explaining companies posture towards environmental and social issues: many business leaders would like more government incentives to encourage them to act (e.g., 2011 Accenture survey).
Global CO2 emissions in the last 150 years
 In the last decades, much attention has been given to global warming and the need for CO2 emissions reduction by society and companies.
This is related and affects also the way in which global supply chains are managed. For instance, lead firms (usually located in developed countries) push suppliers (both in developed and developing countries) to adopt more environmentally friendly technologies, enabling them to reduce CO2 emissions.
In the same time, governments negotiate on targets (take, for instance, the Kyoto protocol), define new regulations and can in turn put pressure on the companies to shift to the adoption of greener technologies.
When discussing these topics, however, we often miss the big picture. What does the long term trend look like? What has actually been done by developed and developing economies? Gapminder (www.gapminder.org ) has developed a nice tool for representation of World Bank data (including CO2 emission) that can help us.
So, let’s create a graph where every dot represents a country. The size of the dot represents the total CO2 emissions. Basically, CO2 emissions depend on the number of people (horizontal axis) and the CO2 emissions per person (vertical axis – a measure of individual consumption). Finally, let’s focus on four countries: Germany, Untied States, India and China, and observe the evolution from 1860 to 2008.
We can identify 5 periods:
- 1860-1900: For the first forty years we have data only for Germany and United States. They start with the same population (around 35 million). Over time, the population of the United States doubles while the CO2 emissions per person in both the United States and Germany increases of ten times in relation with the Second Industrial Revolution.
- 1900-1928: India and China appear on the picture. They already have a much larger and faster growing population with very low and stable emissions per capita. In this period, the First World War takes place, but the effect on the emissions of Germany and United States is limited. Interestingly enough, the United States are able to further increase their consumption (that is, emissions) faster than Germany.
- 1929-1960: the Great Depression in 1929 causes a significant decrease in the United States’ emissions, while the Second World War causes a huge decrease of German emissions. In India and China, the population continues to grow but not the emissions per capita.
- 1960-1990: Germany and the United States recover fast from the crises and maintain a relatively stable situation in terms of emissions (that is, consumptions) and population. In India and China, the population continues to increase with limited increase in the emissions.
- 1990-2008: the United States remain stable, while Germany reduces its emissions per capita. In 2008, in Germany we witness about half of the Americans’ emissions per capita. However, these are small changes compared to those of India and China. In China, the population growth slows down, but the emissions per capita start increasing. It seems that China is now moving vertically, as Germany or the United States did in the 1860s. The problem is (look at the size of the bubble) that China is already emitting as much as the United States. India is instead still on a fast growth population route, so its vertical movement will probably arrive later.
You can also find the original plot at: www.bit.ly/xhWizC
Water footprints
 An interesting article has been published on the Proceedings of the National Academy of Sciences. The study quantifies and maps the water footprint of humanity. Agricultural production accounts for 92% of world’s water footprint. Cereal products, in particular, give the largest contribution to the water consumption of the average consumer (27%), followed by meat (22%) and milk products (7%). The study shows that several countries rely significantly on foreign water resources and that many countries influence water consumption and pollution elsewhere. About one-fifth of the global water footprint is associated to products that are exported. Quite interestingly we tend to virtually import a huge amount of water consumption we are not aware of. An example? A coffee with milk cup needs 200 liters of water to be manufactured, from field to cup.

Università degli Studi di Bergamo
